Presenting data from line graphs
Line graphs usually report data over time. Therefore, you have to write about changing trends at specific points in the past, and often you have to speculate about the future. You also need to be very good at time expressions with the appropriate verb tense!
sales (Up to now)Lorem ipsum dolor sit amet, consectetur adipiscing elit, sed do eiusmod tempor incididunt ut labore et dolore magna aliqua. Ut enim ad minim veniam.

|
air quality (past)
|
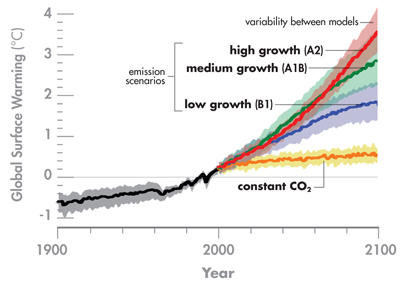
climate change (projection into the future)
|
