describing pie charts in an academic presentation
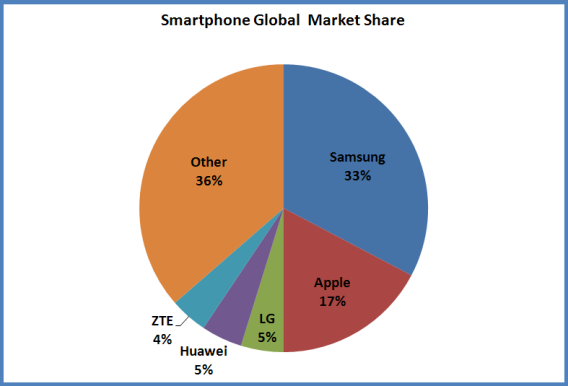
Market share
|
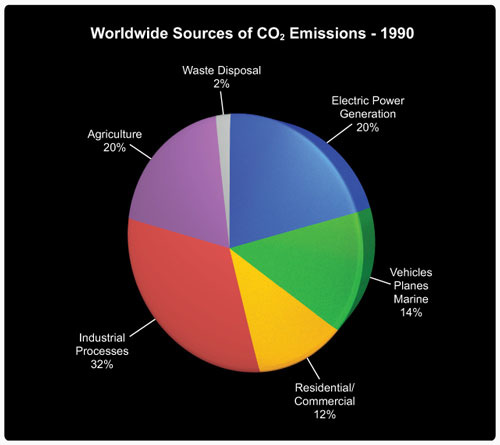
co2 emissions
|
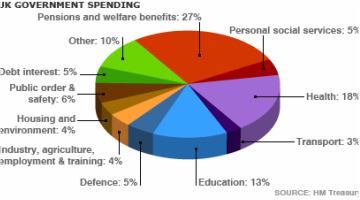
spending
NOTE - when the year/s are clearly stated - use past tense top describe the data, but still use present tense to describe the pie chart itself |
